【机器学习入门与实践】二手车价格交易预测含EDA、特征工程、特征优化、模型融合
时间:2025-07-25 作者:游乐小编
该内容围绕二手车交易价格预测大赛展开,介绍赛题是回归问题,需根据给定数据集预测价格。说明了数据来源、训练集和测试集划分,以及各变量信息。还涵盖数据读取、探索、分析,模型训练(如xgb、lgb)、预测、融合等流程,包括特征工程和模型优化等内容。

1.项目简介
二手车交易价格预测大赛赛题以二手车市场为背景,要求选手预测二手汽车的交易价格,这是一个是非常经典项目的回归问题。为了更好的引导大家入门,本项目设置了系列学习方案,其中包括数据科学库、通用流程和baseline方案学习三部分。通过对本方案的完整学习,可以帮助掌握数据竞赛基本技能。现让更多对机器学习感兴趣小伙伴可以上手实战一下,因篇幅内容限制,将原学习项目拆解成多个notebook方便学习,只需一键fork。
推荐项目:【机器学习入门与实践】合集入门必看系列,含数据挖掘项目实战
方便入门同学快速掌握相关知识进行实战
1.1 数据说明
比赛要求参赛选手根据给定的数据集,建立模型,二手汽车的交易价格。
来自 Ebay Kleinanzeigen 报废的二手车,数量超过 370,000,包含 20 列变量信息,为了保证 比赛的公平性,将会从中抽取 10 万条作为训练集,5 万条作为测试集 A,5 万条作为测试集 B。同时会对名称、车辆类型、变速箱、model、燃油类型、品牌、公里数、价格等信息进行 脱敏。
一般而言,对于数据在比赛界面都有对应的数据概况介绍(匿名特征除外),说明列的性质特征。了解列的性质会有助于我们对于数据的理解和后续分析。 Tip:匿名特征,就是未告知数据列所属的性质的特征列。
train.csv
name - 汽车编码regDate - 汽车注册时间model - 车型编码brand - 品牌bodyType - 车身类型fuelType - 燃油类型gearbox - 变速箱power - 汽车功率kilometer - 汽车行驶公里notRepairedDamage - 汽车有尚未修复的损坏regionCode - 看车地区编码seller - 销售方offerType - 报价类型creatDate - 广告发布时间price - 汽车价格v_0', 'v_1', 'v_2', 'v_3', 'v_4', 'v_5', 'v_6', 'v_7', 'v_8', 'v_9', 'v_10', 'v_11', 'v_12', 'v_13','v_14'(根据汽车的评论、标签等大量信息得到的embedding向量)【人工构造 匿名特征】数字全都脱敏处理,都为label encoding形式,即数字形式
1.2预测指标
本赛题的评价标准为MAE(Mean Absolute Error):
MAE=n∑i=1n∣yi−y^i∣
其中yi代表第i个样本的真实值,其中y^i代表第i个样本的预测值。
一般问题评价指标说明:
什么是评估指标:
评估指标即是我们对于一个模型效果的数值型量化。(有点类似与对于一个商品评价打分,而这是针对于模型效果和理想效果之间的一个打分)
一般来说分类和回归问题的评价指标有如下一些形式:
分类算法常见的评估指标如下:
对于二类分类器/分类算法,评价指标主要有accuracy, [Precision,Recall,F-score,Pr曲线],ROC-AUC曲线。对于多类分类器/分类算法,评价指标主要有accuracy, [宏平均和微平均,F-score]。对于回归预测类常见的评估指标如下:
平均绝对误差(Mean Absolute Error,MAE),均方误差(Mean Squared Error,MSE),平均绝对百分误差(Mean Absolute Percentage Error,MAPE),均方根误差(Root Mean Squared Error), R2(R-Square)平均绝对误差 平均绝对误差(Mean Absolute Error,MAE):平均绝对误差,其能更好地反映预测值与真实值误差的实际情况,其计算公式如下:
MAE=N1i=1∑N∣yi−y^i∣
均方误差 均方误差(Mean Squared Error,MSE),均方误差,其计算公式为:
MSE=N1i=1∑N(yi−y^i)2
R2(R-Square)的公式为: 残差平方和:
SSres=∑(yi−y^i)2
总平均值:
SStot=∑(yi−yi)2
其中y表示y的平均值 得到R2表达式为:
R2=1−SStotSSres=1−∑(yi−y)2∑(yi−y^i)2
R2用于度量因变量的变异中可由自变量解释部分所占的比例,取值范围是 0~1,R2越接近1,表明回归平方和占总平方和的比例越大,回归线与各观测点越接近,用x的变化来解释y值变化的部分就越多,回归的拟合程度就越好。所以R2也称为拟合优度(Goodness of Fit)的统计量。
yi表示真实值,y^i表示预测值,yi表示样本均值。得分越高拟合效果越好。
1.3分析赛题
此题为传统的数据挖掘问题,通过数据科学以及机器学习深度学习的办法来进行建模得到结果。此题是一个典型的回归问题。主要应用xgb、lgb、catboost,以及pandas、numpy、matplotlib、seabon、sklearn、keras等等数据挖掘常用库或者框架来进行数据挖掘任务。1.4 内容大纲
了解赛题
赛题概况
数据概况
预测指标
分析赛题
数据读取pandas
分类指标评价计算示例
回归指标评价计算示例
EDA探索
载入各种数据科学以及可视化库载入数据总览数据概况判断数据缺失和异常了解预测值的分布特征分为类别特征和数字特征,并对类别特征查看unique分布数字特征分析类别特征分析用pandas_profiling生成数据报告特征工程
导入数据删除异常值特征构造特征筛选建模调参,相关原理介绍与推荐
线性回归模型决策树模型GBDT模型XGBoost模型LightGBM模型推荐教材读取数据线性回归 & 五折交叉验证 & 模拟真实业务情况多种模型对比模型调参模型融合
回归\分类概率-融合分类模型融合一些其它方法本赛题示例2.数据探索
In [1]# 下载数据!wget https://tianchi-media.oss-cn-beijing.aliyuncs.com/dragonball/DM/data.zip# 解压下载好的数据!unzip data.zip登录后复制 In [2]
# 导入函数工具## 基础工具import numpy as npimport pandas as pdimport warningsimport matplotlibimport matplotlib.pyplot as pltimport seaborn as snsfrom scipy.special import jnfrom IPython.display import display, clear_outputimport timewarnings.filterwarnings('ignore')%matplotlib inline## 模型预测的from sklearn import linear_modelfrom sklearn import preprocessingfrom sklearn.svm import SVRfrom sklearn.ensemble import RandomForestRegressor,GradientBoostingRegressor## 数据降维处理的from sklearn.decomposition import PCA,FastICA,FactorAnalysis,SparsePCAimport lightgbm as lgbimport xgboost as xgb## 参数搜索和评价的from sklearn.model_selection import GridSearchCV,cross_val_score,StratifiedKFold,train_test_splitfrom sklearn.metrics import mean_squared_error, mean_absolute_error登录后复制 2.1 数据读取
In [3]## 通过Pandas对于数据进行读取 (pandas是一个很友好的数据读取函数库)Train_data = pd.read_csv('/home/aistudio/dataset/used_car_train_20200313.csv', sep=' ')TestA_data = pd.read_csv('/home/aistudio/dataset/used_car_testA_20200313.csv', sep=' ')## 输出数据的大小信息print('Train data shape:',Train_data.shape)print('TestA data shape:',TestA_data.shape)登录后复制 Train data shape: (150000, 31)TestA data shape: (50000, 30)登录后复制
2.2 数据简要浏览
In [4]## 通过.head() 简要浏览读取数据的形式Train_data.head()登录后复制
SaleID name regDate model brand bodyType fuelType gearbox power \0 0 736 20040402 30.0 6 1.0 0.0 0.0 60 1 1 2262 20030301 40.0 1 2.0 0.0 0.0 0 2 2 14874 20040403 115.0 15 1.0 0.0 0.0 163 3 3 71865 19960908 109.0 10 0.0 0.0 1.0 193 4 4 111080 20120103 110.0 5 1.0 0.0 0.0 68 kilometer ... v_5 v_6 v_7 v_8 v_9 v_10 \0 12.5 ... 0.235676 0.101988 0.129549 0.022816 0.097462 -2.881803 1 15.0 ... 0.264777 0.121004 0.135731 0.026597 0.020582 -4.900482 2 12.5 ... 0.251410 0.114912 0.165147 0.062173 0.027075 -4.846749 3 15.0 ... 0.274293 0.110300 0.121964 0.033395 0.000000 -4.509599 4 5.0 ... 0.228036 0.073205 0.091880 0.078819 0.121534 -1.896240 v_11 v_12 v_13 v_14 0 2.804097 -2.420821 0.795292 0.914762 1 2.096338 -1.030483 -1.722674 0.245522 2 1.803559 1.565330 -0.832687 -0.229963 3 1.285940 -0.501868 -2.438353 -0.478699 4 0.910783 0.931110 2.834518 1.923482 [5 rows x 31 columns]登录后复制
2.3 数据信息查看
In [5]## 通过 .info() 简要可以看到对应一些数据列名,以及NAN缺失信息Train_data.info()登录后复制
登录后复制 In [6]RangeIndex: 150000 entries, 0 to 149999Data columns (total 31 columns): # Column Non-Null Count Dtype --- ------ -------------- ----- 0 SaleID 150000 non-null int64 1 name 150000 non-null int64 2 regDate 150000 non-null int64 3 model 149999 non-null float64 4 brand 150000 non-null int64 5 bodyType 145494 non-null float64 6 fuelType 141320 non-null float64 7 gearbox 144019 non-null float64 8 power 150000 non-null int64 9 kilometer 150000 non-null float64 10 notRepairedDamage 150000 non-null object 11 regionCode 150000 non-null int64 12 seller 150000 non-null int64 13 offerType 150000 non-null int64 14 creatDate 150000 non-null int64 15 price 150000 non-null int64 16 v_0 150000 non-null float64 17 v_1 150000 non-null float64 18 v_2 150000 non-null float64 19 v_3 150000 non-null float64 20 v_4 150000 non-null float64 21 v_5 150000 non-null float64 22 v_6 150000 non-null float64 23 v_7 150000 non-null float64 24 v_8 150000 non-null float64 25 v_9 150000 non-null float64 26 v_10 150000 non-null float64 27 v_11 150000 non-null float64 28 v_12 150000 non-null float64 29 v_13 150000 non-null float64 30 v_14 150000 non-null float64dtypes: float64(20), int64(10), object(1)memory usage: 35.5+ MB
## 通过 .columns 查看列名Train_data.columns登录后复制
Index(['SaleID', 'name', 'regDate', 'model', 'brand', 'bodyType', 'fuelType', 'gearbox', 'power', 'kilometer', 'notRepairedDamage', 'regionCode', 'seller', 'offerType', 'creatDate', 'price', 'v_0', 'v_1', 'v_2', 'v_3', 'v_4', 'v_5', 'v_6', 'v_7', 'v_8', 'v_9', 'v_10', 'v_11', 'v_12', 'v_13', 'v_14'], dtype='object')登录后复制 In [7]
TestA_data.info()登录后复制
登录后复制RangeIndex: 50000 entries, 0 to 49999Data columns (total 30 columns): # Column Non-Null Count Dtype --- ------ -------------- ----- 0 SaleID 50000 non-null int64 1 name 50000 non-null int64 2 regDate 50000 non-null int64 3 model 50000 non-null float64 4 brand 50000 non-null int64 5 bodyType 48587 non-null float64 6 fuelType 47107 non-null float64 7 gearbox 48090 non-null float64 8 power 50000 non-null int64 9 kilometer 50000 non-null float64 10 notRepairedDamage 50000 non-null object 11 regionCode 50000 non-null int64 12 seller 50000 non-null int64 13 offerType 50000 non-null int64 14 creatDate 50000 non-null int64 15 v_0 50000 non-null float64 16 v_1 50000 non-null float64 17 v_2 50000 non-null float64 18 v_3 50000 non-null float64 19 v_4 50000 non-null float64 20 v_5 50000 non-null float64 21 v_6 50000 non-null float64 22 v_7 50000 non-null float64 23 v_8 50000 non-null float64 24 v_9 50000 non-null float64 25 v_10 50000 non-null float64 26 v_11 50000 non-null float64 27 v_12 50000 non-null float64 28 v_13 50000 non-null float64 29 v_14 50000 non-null float64dtypes: float64(20), int64(9), object(1)memory usage: 11.4+ MB
2.4 数据统计信息浏览
In [8]## 通过 .describe() 可以查看数值特征列的一些统计信息Train_data.describe()登录后复制
SaleID name regDate model \count 150000.000000 150000.000000 1.500000e+05 149999.000000 mean 74999.500000 68349.172873 2.003417e+07 47.129021 std 43301.414527 61103.875095 5.364988e+04 49.536040 min 0.000000 0.000000 1.991000e+07 0.000000 25% 37499.750000 11156.000000 1.999091e+07 10.000000 50% 74999.500000 51638.000000 2.003091e+07 30.000000 75% 112499.250000 118841.250000 2.007111e+07 66.000000 max 149999.000000 196812.000000 2.015121e+07 247.000000 brand bodyType fuelType gearbox \count 150000.000000 145494.000000 141320.000000 144019.000000 mean 8.052733 1.792369 0.375842 0.224943 std 7.864956 1.760640 0.548677 0.417546 min 0.000000 0.000000 0.000000 0.000000 25% 1.000000 0.000000 0.000000 0.000000 50% 6.000000 1.000000 0.000000 0.000000 75% 13.000000 3.000000 1.000000 0.000000 max 39.000000 7.000000 6.000000 1.000000 power kilometer ... v_5 v_6 \count 150000.000000 150000.000000 ... 150000.000000 150000.000000 mean 119.316547 12.597160 ... 0.248204 0.044923 std 177.168419 3.919576 ... 0.045804 0.051743 min 0.000000 0.500000 ... 0.000000 0.000000 25% 75.000000 12.500000 ... 0.243615 0.000038 50% 110.000000 15.000000 ... 0.257798 0.000812 75% 150.000000 15.000000 ... 0.265297 0.102009 max 19312.000000 15.000000 ... 0.291838 0.151420 v_7 v_8 v_9 v_10 \count 150000.000000 150000.000000 150000.000000 150000.000000 mean 0.124692 0.058144 0.061996 -0.001000 std 0.201410 0.029186 0.035692 3.772386 min 0.000000 0.000000 0.000000 -9.168192 25% 0.062474 0.035334 0.033930 -3.722303 50% 0.095866 0.057014 0.058484 1.624076 75% 0.125243 0.079382 0.087491 2.844357 max 1.404936 0.160791 0.222787 12.357011 v_11 v_12 v_13 v_14 count 150000.000000 150000.000000 150000.000000 150000.000000 mean 0.009035 0.004813 0.000313 -0.000688 std 3.286071 2.517478 1.288988 1.038685 min -5.558207 -9.639552 -4.153899 -6.546556 25% -1.951543 -1.871846 -1.057789 -0.437034 50% -0.358053 -0.130753 -0.036245 0.141246 75% 1.255022 1.776933 0.942813 0.680378 max 18.819042 13.847792 11.147669 8.658418 [8 rows x 30 columns]登录后复制 In [9]
TestA_data.describe()登录后复制
SaleID name regDate model brand \count 50000.000000 50000.000000 5.000000e+04 50000.000000 50000.000000 mean 174999.500000 68542.223280 2.003393e+07 46.844520 8.056240 std 14433.901067 61052.808133 5.368870e+04 49.469548 7.819477 min 150000.000000 0.000000 1.991000e+07 0.000000 0.000000 25% 162499.750000 11203.500000 1.999091e+07 10.000000 1.000000 50% 174999.500000 52248.500000 2.003091e+07 29.000000 6.000000 75% 187499.250000 118856.500000 2.007110e+07 65.000000 13.000000 max 199999.000000 196805.000000 2.015121e+07 246.000000 39.000000 bodyType fuelType gearbox power kilometer \count 48587.000000 47107.000000 48090.000000 50000.000000 50000.000000 mean 1.782185 0.373405 0.224350 119.883620 12.595580 std 1.760736 0.546442 0.417158 185.097387 3.908979 min 0.000000 0.000000 0.000000 0.000000 0.500000 25% 0.000000 0.000000 0.000000 75.000000 12.500000 50% 1.000000 0.000000 0.000000 109.000000 15.000000 75% 3.000000 1.000000 0.000000 150.000000 15.000000 max 7.000000 6.000000 1.000000 20000.000000 15.000000 ... v_5 v_6 v_7 v_8 \count ... 50000.000000 50000.000000 50000.000000 50000.000000 mean ... 0.248669 0.045021 0.122744 0.057997 std ... 0.044601 0.051766 0.195972 0.029211 min ... 0.000000 0.000000 0.000000 0.000000 25% ... 0.243762 0.000044 0.062644 0.035084 50% ... 0.257877 0.000815 0.095828 0.057084 75% ... 0.265328 0.102025 0.125438 0.079077 max ... 0.291618 0.153265 1.358813 0.156355 v_9 v_10 v_11 v_12 v_13 \count 50000.000000 50000.000000 50000.000000 50000.000000 50000.000000 mean 0.062000 -0.017855 -0.013742 -0.013554 -0.003147 std 0.035653 3.747985 3.231258 2.515962 1.286597 min 0.000000 -9.160049 -5.411964 -8.916949 -4.123333 25% 0.033714 -3.700121 -1.971325 -1.876703 -1.060428 50% 0.058764 1.613212 -0.355843 -0.142779 -0.035956 75% 0.087489 2.832708 1.262914 1.764335 0.941469 max 0.214775 12.338872 18.856218 12.950498 5.913273 v_14 count 50000.000000 mean 0.001516 std 1.027360 min -6.112667 25% -0.437920 50% 0.138799 75% 0.681163 max 2.624622 [8 rows x 29 columns]登录后复制
3.数据分析
In [10]#### 1) 提取数值类型特征列名numerical_cols = Train_data.select_dtypes(exclude = 'object').columnsprint(numerical_cols)登录后复制
Index(['SaleID', 'name', 'regDate', 'model', 'brand', 'bodyType', 'fuelType', 'gearbox', 'power', 'kilometer', 'regionCode', 'seller', 'offerType', 'creatDate', 'price', 'v_0', 'v_1', 'v_2', 'v_3', 'v_4', 'v_5', 'v_6', 'v_7', 'v_8', 'v_9', 'v_10', 'v_11', 'v_12', 'v_13', 'v_14'], dtype='object')登录后复制 In [11]
categorical_cols = Train_data.select_dtypes(include = 'object').columnsprint(categorical_cols)登录后复制
Index(['notRepairedDamage'], dtype='object')登录后复制 In [12]
#### 2) 构建训练和测试样本## 选择特征列feature_cols = [col for col in numerical_cols if col not in ['SaleID','name','regDate','creatDate','price','model','brand','regionCode','seller']]feature_cols = [col for col in feature_cols if 'Type' not in col]## 提前特征列,标签列构造训练样本和测试样本X_data = Train_data[feature_cols]Y_data = Train_data['price']X_test = TestA_data[feature_cols]print('X train shape:',X_data.shape)print('X test shape:',X_test.shape)登录后复制 X train shape: (150000, 18)X test shape: (50000, 18)登录后复制 In [13]
## 定义了一个统计函数,方便后续信息统计def Sta_inf(data): print('_min',np.min(data)) print('_max:',np.max(data)) print('_mean',np.mean(data)) print('_ptp',np.ptp(data)) print('_std',np.std(data)) print('_var',np.var(data))登录后复制 In [14]#### 3) 统计标签的基本分布信息print('Sta of label:')Sta_inf(Y_data)登录后复制 Sta of label:_min 11_max: 99999_mean 5923.327333333334_ptp 99988_std 7501.973469876635_var 56279605.942732885登录后复制 In [15]
## 绘制标签的统计图,查看标签分布plt.hist(Y_data)plt.show()plt.close()登录后复制
登录后复制 In [16]
#### 4) 缺省值用-1填补X_data = X_data.fillna(-1)X_test = X_test.fillna(-1)登录后复制
4. 模型训练与预测(特征工程、模型融合)
4.1 利用xgb进行五折交叉验证查看模型的参数效果
In [ ]## xgb-Modelxgr = xgb.XGBRegressor(n_estimators=120, learning_rate=0.1, gamma=0, subsample=0.8,\ colsample_bytree=0.9, max_depth=7) #,objective ='reg:squarederror'scores_train = []scores = []## 5折交叉验证方式sk=StratifiedKFold(n_splits=5,shuffle=True,random_state=0)for train_ind,val_ind in sk.split(X_data,Y_data): train_x=X_data.iloc[train_ind].values train_y=Y_data.iloc[train_ind] val_x=X_data.iloc[val_ind].values val_y=Y_data.iloc[val_ind] xgr.fit(train_x,train_y) pred_train_xgb=xgr.predict(train_x) pred_xgb=xgr.predict(val_x) score_train = mean_absolute_error(train_y,pred_train_xgb) scores_train.append(score_train) score = mean_absolute_error(val_y,pred_xgb) scores.append(score)print('Train mae:',np.mean(score_train))print('Val mae',np.mean(scores))登录后复制 4.2 定义xgb和lgb模型函数
In [ ]def build_model_xgb(x_train,y_train): model = xgb.XGBRegressor(n_estimators=150, learning_rate=0.1, gamma=0, subsample=0.8,\ colsample_bytree=0.9, max_depth=7) #, objective ='reg:squarederror' model.fit(x_train, y_train) return modeldef build_model_lgb(x_train,y_train): estimator = lgb.LGBMRegressor(num_leaves=127,n_estimators = 150) param_grid = { 'learning_rate': [0.01, 0.05, 0.1, 0.2], } gbm = GridSearchCV(estimator, param_grid) gbm.fit(x_train, y_train) return gbm登录后复制 4.3 切分数据集(Train,Val)进行模型训练,评价和预测
In [ ]## Split data with valx_train,x_val,y_train,y_val = train_test_split(X_data,Y_data,test_size=0.3)登录后复制 In [ ]
print('Train lgb...')model_lgb = build_model_lgb(x_train,y_train)val_lgb = model_lgb.predict(x_val)MAE_lgb = mean_absolute_error(y_val,val_lgb)print('MAE of val with lgb:',MAE_lgb)print('Predict lgb...')model_lgb_pre = build_model_lgb(X_data,Y_data)subA_lgb = model_lgb_pre.predict(X_test)print('Sta of Predict lgb:')Sta_inf(subA_lgb)登录后复制 In [ ]print('Train xgb...')model_xgb = build_model_xgb(x_train,y_train)val_xgb = model_xgb.predict(x_val)MAE_xgb = mean_absolute_error(y_val,val_xgb)print('MAE of val with xgb:',MAE_xgb)print('Predict xgb...')model_xgb_pre = build_model_xgb(X_data,Y_data)subA_xgb = model_xgb_pre.predict(X_test)print('Sta of Predict xgb:')Sta_inf(subA_xgb)登录后复制 4.4进行两模型的结果加权融合
In [ ]## 这里我们采取了简单的加权融合的方式val_Weighted = (1-MAE_lgb/(MAE_xgb+MAE_lgb))*val_lgb+(1-MAE_xgb/(MAE_xgb+MAE_lgb))*val_xgbval_Weighted[val_Weighted<0]=10 # 由于我们发现预测的最小值有负数,而真实情况下,price为负是不存在的,由此我们进行对应的后修正print('MAE of val with Weighted ensemble:',mean_absolute_error(y_val,val_Weighted))登录后复制 In [ ]sub_Weighted = (1-MAE_lgb/(MAE_xgb+MAE_lgb))*subA_lgb+(1-MAE_xgb/(MAE_xgb+MAE_lgb))*subA_xgb## 查看预测值的统计进行plt.hist(Y_data)plt.show()plt.close()登录后复制
4.5.输出结果
In [ ]sub = pd.DataFrame()sub['SaleID'] = TestA_data.SaleIDsub['price'] = sub_Weightedsub.to_csv('./sub_Weighted.csv',index=False)登录后复制 In [ ]sub.head()登录后复制
5. 项目详细展开
因篇幅内容限制,将原学习项目拆解成多个notebook方便学习,只需一键fork。

5.1 数据分析详解
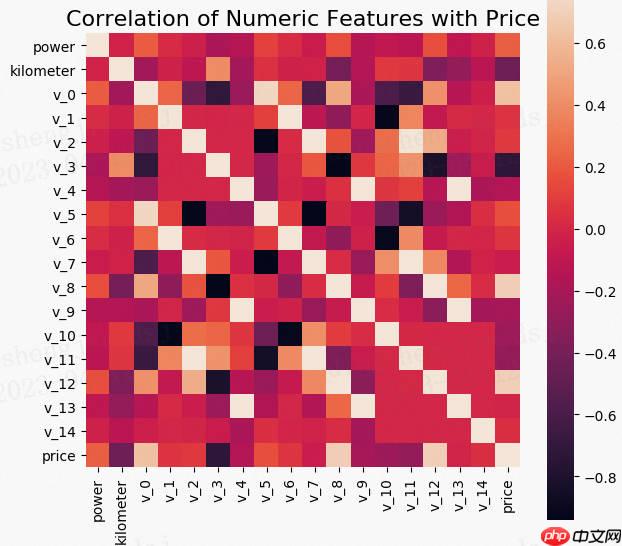
载入各种数据科学以及可视化库:数据科学库 pandas、numpy、scipy;可视化库 matplotlib、seabon;其他;载入数据:载入训练集和测试集;简略观察数据(head()+shape);数据总览:通过describe()来熟悉数据的相关统计量通过info()来熟悉数据类型判断数据缺失和异常查看每列的存在nan情况异常值检测了解预测值的分布总体分布概况(无界约翰逊分布等)查看skewness and kurtosis查看预测值的具体频数特征分为类别特征和数字特征,并对类别特征查看unique分布数字特征分析相关性分析查看几个特征得 偏度和峰值每个数字特征得分布可视化数字特征相互之间的关系可视化多变量互相回归关系可视化类型特征分析unique分布类别特征箱形图可视化类别特征的小提琴图可视化类别特征的柱形图可视化类别特征的每个类别频数可视化(count_plot)用pandas_profiling生成数据报告
5.2 特征工程
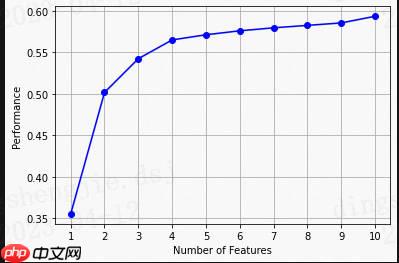
异常处理:通过箱线图(或 3-Sigma)分析删除异常值;BOX-COX 转换(处理有偏分布);长尾截断;特征归一化/标准化:标准化(转换为标准正态分布);归一化(抓换到 [0,1] 区间);针对幂律分布,可以采用公式: log(1+median1+x)数据分桶:等频分桶;等距分桶;Best-KS 分桶(类似利用基尼指数进行二分类);卡方分桶;缺失值处理:不处理(针对类似 XGBoost 等树模型);删除(缺失数据太多);插值补全,包括均值/中位数/众数/建模预测/多重插补/压缩感知补全/矩阵补全等;分箱,缺失值一个箱;特征构造:构造统计量特征,报告计数、求和、比例、标准差等;时间特征,包括相对时间和绝对时间,节假日,双休日等;地理信息,包括分箱,分布编码等方法;非线性变换,包括 log/ 平方/ 根号等;特征组合,特征交叉;仁者见仁,智者见智。特征筛选过滤式(filter):先对数据进行特征选择,然后在训练学习器,常见的方法有 Relief/方差选择发/相关系数法/卡方检验法/互信息法;包裹式(wrapper):直接把最终将要使用的学习器的性能作为特征子集的评价准则,常见方法有 LVM(Las Vegas Wrapper) ;嵌入式(embedding):结合过滤式和包裹式,学习器训练过程中自动进行了特征选择,常见的有 lasso 回归;降维PCA/ LDA/ ICA;特征选择也是一种降维。
5.3 模型优化
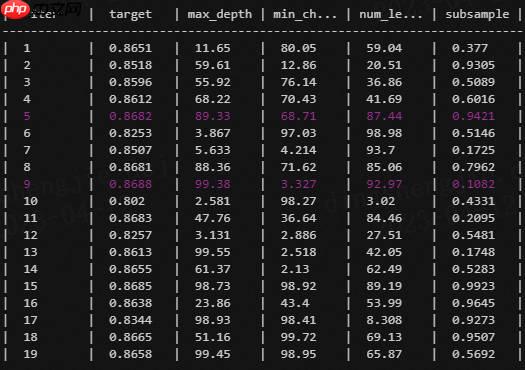
线性回归模型:线性回归对于特征的要求;处理长尾分布;理解线性回归模型;模型性能验证:评价函数与目标函数;交叉验证方法;留一验证方法;针对时间序列问题的验证;绘制学习率曲线;绘制验证曲线;嵌入式特征选择:Lasso回归;Ridge回归;决策树;模型对比:常用线性模型;常用非线性模型;模型调参:贪心调参方法;网格调参方法;贝叶斯调参方法;
5.4模型融合
简单加权融合:
回归(分类概率):算术平均融合(Arithmetic mean),几何平均融合(Geometric mean);分类:投票(Voting)综合:排序融合(Rank averaging),log融合stacking/blending:
构建多层模型,并利用预测结果再拟合预测。boosting/bagging(在xgboost,Adaboost,GBDT中已经用到):
多树的提升方法训练:

预测:

小编推荐:
相关攻略
更多 - ftp扫描工具跨平台 ftp扫描工具多系统支持 07.25
- 电脑如何清理重复文件 查找并删除重复内容技巧 07.25
- WPS表格数据可视化 动态图表制作永久免会员 07.25
- 如何让豆包AI生成代码 豆包AI编程辅助教程 07.25
- 豆包AI如何实现自动化 豆包AI自动化编程指南 07.25
- AI语言转视频结合AI字幕工具实现完整内容自动化 07.25
- 【飞桨论文复现赛-图像描述生成】Soft-Attention 07.25
- ftp扫描工具免费版 ftp扫描工具付费版区别 07.24
热门推荐
更多 热门文章
更多 -

- 神角技巧试炼岛高级宝箱在什么位置
-
2021-11-05 11:52
手游攻略
-

- 王者荣耀音乐扭蛋机活动内容奖励详解
-
2021-11-19 18:38
手游攻略
-

- 坎公骑冠剑11
-
2021-10-31 23:18
手游攻略
-

- 原神卡肉是什么意思
-
2022-06-03 14:46
游戏资讯
-

- 《臭作》之100%全完整攻略
-
2025-06-28 12:37
单机攻略


